Development Tools
VUEngine provides a couple of tools that aim to help to understand how the hardware resources are being used at any moment, to provide a lead on where to look to improve the game’s performance.
In order to make some of them available, the build target must be either “tools” or “debug”. Each one is opened by pressing a key combination.
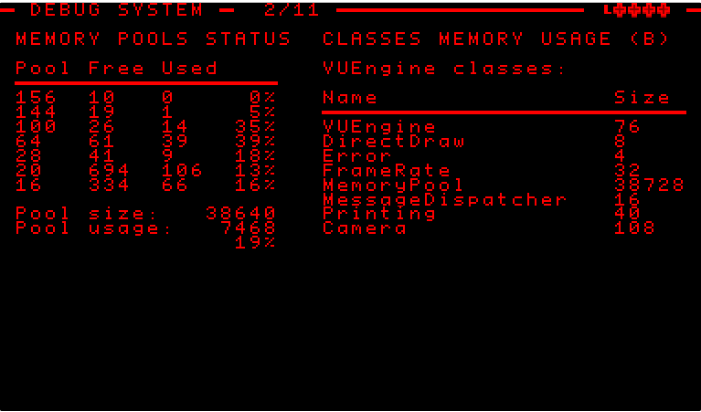
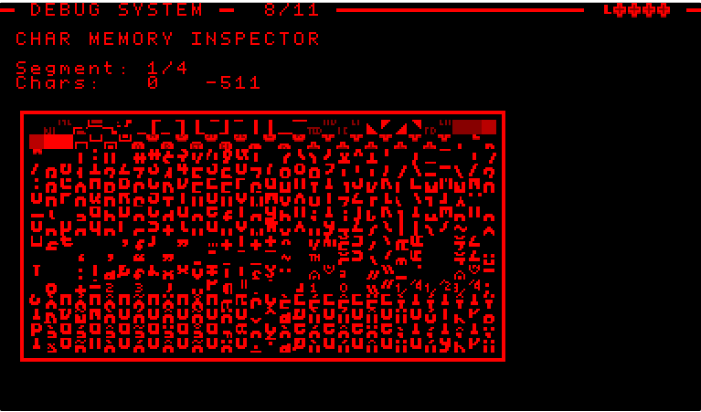
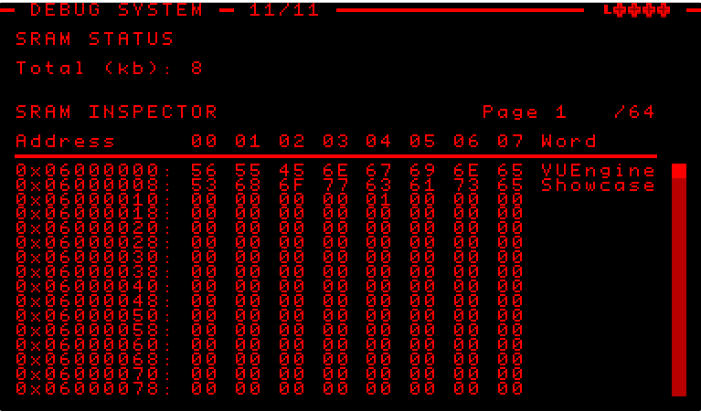
# Debug Inspector
Key combination: Hold Select + Right Trigger and press Up on the right D-Pad.
The Debug Inspector shows pages with information about WRAM usage, video memory usage (WORLDs, BGMAPs, OBJECTs and CHARs), the Stage’s status, collisions information, hardware registers, SRAM space, etc.
Cycle through the different modes with the Left D-Pad.
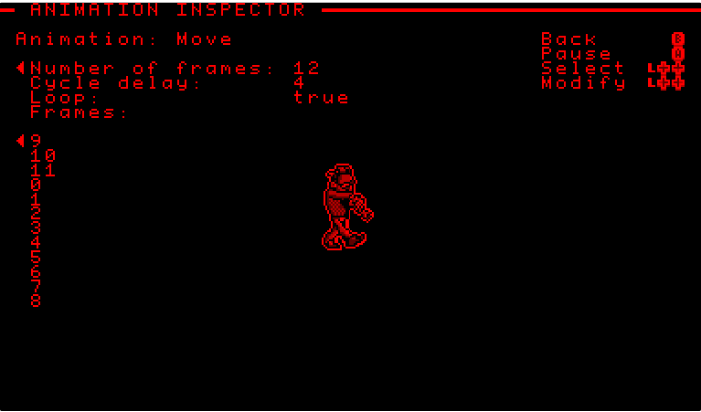
# Animation Inspector
Key combination: Hold Select + Right Trigger and press Right on the right D-Pad.
The Animation Inspector shows a preview of the animations available through SpriteSpec listed in the global _userAnimatedActors:
const UserActor _userAnimatedActors[] =
{
    {&ActorSpec, "Actor"},
    {NULL, ""},
};
It allows to modify at runtime the frames of animation and the duration of each:
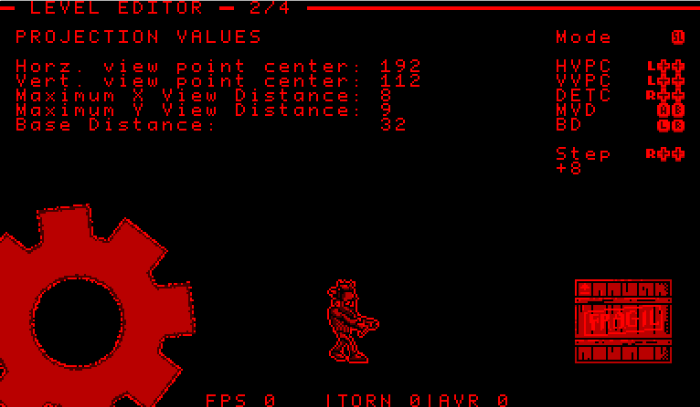
# Stage Inspector
Key combination: Hold Select + Right Trigger and press Left on the right D-Pad.
The Stage Inspector allows to modify the Stage’s optical settings, or to move around Actors in the current Stage and even to add new ones through the ActorSpecs listed in the global _userObjects.
Cycle through the different modes with the Select button.
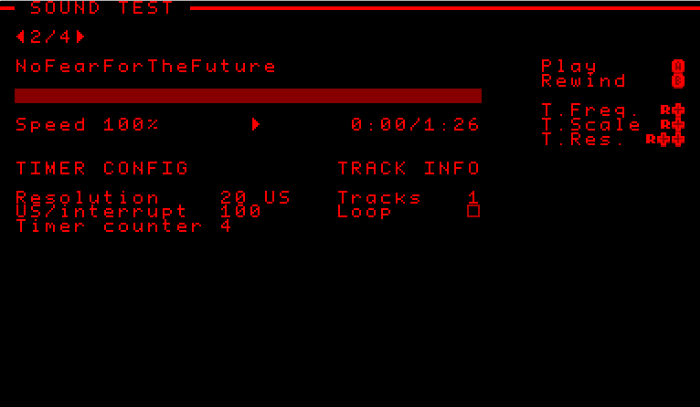
# Sound Test
Key combination: Hold Select + Right Trigger and press Down on the right D-Pad.
The Sound Test allows to play sounds through the SoundSpecs listed in the global _userSounds and to modify at runtime the timer settings to test how the sound tolerates changes to the timer interrupt’s frequency.
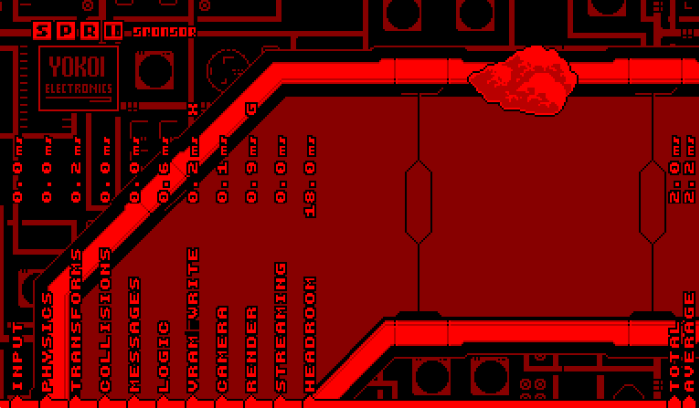
# Profiler
The Profiler can be used to help spot and solve performance bottlenecks by displaying the approximate time in milliseconds that each of the engine’s subprocesses take to complete.
To enable the profiler, the __ENABLE_PROFILER macro must be defined in the game’s Config.h header file:
#define __ENABLE_PROFILER
Then, call the following at the point where profiling must start:
VUEngine::startProfiling();
Then, the profiler will show the following output: